All articles
Improving your data literacy in 2021 – by Michelle Knight
Data literacy consists of the ability” to read, work with, analyze and argue with sets of data.” This competence translates raw numbers and text into effective communications, decisions, and actions.
Published
Category
Improving your data literacy in 2021 – by Michelle Knight

Michelle Knight | March 18, 2021
In 2021, I, along with many others, will improve my data literacy, skills to translate and communicate data. My technical writing projects have become more demanding in understanding data.
For example, I will be writing a Trends in Data Management Report that compares 2021, 2020, and 2019 survey data. This March, I will be compiling bar charts and telling the data management’s fact-based story, interpreted by an analyst. I am responsible for accurate and logically sound documentation, among other increased data literacy demands. I am not alone.
According to a Qlik and Accenture study, only 21% of the global workforce feel fully confident of their data literacy skills, and 36% would find an alternative method to complete a task without using data. This article will introduce data literacy and give some tips towards improving data literacy while working.
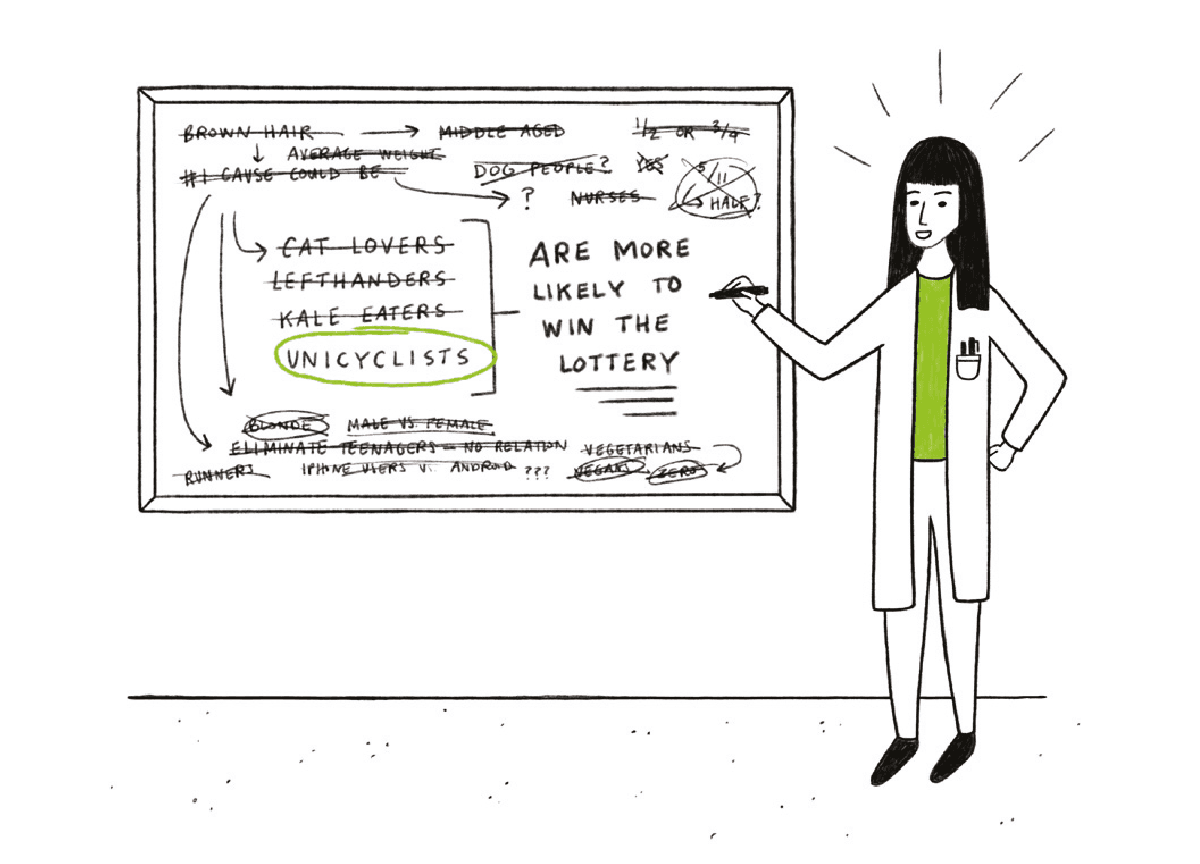
Data fallacies to avoid
Image Courtesy of Geckoboard
What is data literacy?
Data literacy consists of the ability” to read, work with, analyze and argue with sets of data.” This competence translates raw numbers and text into effective communications, decisions, and actions.
I do not doubt that many people pick up some aspects of data literacy through experience or education. People use data to count cards, compare different prices while shopping, and decide the fastest route between home and a friend’s house. As an upper-middle-class white person educated in New England, I learned how to check values using estimation and reading graphs and charts in school.
But any sort of fragmented data education will need to be augmented in the 21st century. The sheer amount and variety of data available in a short time frame make well-rounded data literacy essential.
Go back to 2002, and only 6% of Americans had a mobile device connected to the internet. In 2020 more than 80% of Americans get their news from a mobile device, where daily graphs and stats abound. Speaking the language of data has grown more common, driving data literacy.
Why is data literacy important for technical writers?
Technical writers need to speak data, present trustworthy evidence, and connect the dots for those less knowledgeable about handling data. Most specifically, technical writers need to:
Communicate data within its given context: Misunderstanding and miscommunicating about data and its context leads to confusion and difficulty implementing good decisions. Information needs to be timely and justified
The debate about wearing cloth masks during the COVID-19 pandemic has hit this point home. In an interview with 60 Minutes on March 8, 2020, Dr. Fauci advised against wearing masks unless ill or caring for someone sick.
In March, Fauci made his statement when scientists had little data about COVID-19’s spread, and health care providers did not have enough protective equipment. When the situation changed in April 2020, based on anecdotal evidence and studies demonstrating asymptomatic COVID, Fauci advised Americans to wear masks.
Based on the different data alone, a technical writer could make a case for or against wearing masks. But without the appropriate context and complete relevant information, the reader gets lost, and the data gets misunderstood. The technical writer needs to be responsible for the data and its context.Think critically about data and results: Technical writers, while not necessarily expected to be deep subject matter experts, need to think critically throughout the writing about the data in their documentation and question subject matter experts about dubious data.
Recently, technology sites have blocked some incorrect and unverifiable information and face pressure to do more. Over the next four years, governments will likely pass regulations to stop disinformation.
This prospect of increased legal oversite means that documents with glaring errors in data and information presented to be factual risk removal from a website. Should a technical writer’s company be responsible for the disinformation, expect that employee to face discipline.
In either case, the technical writer faces increased liability for the misinformation. A technical writer’s career will depend on getting the data right.Keep aware of biases: Just because conclusions drawn from data sets make sense does not mean they should inform decisions and actions with that data. The methodology obtaining the data may not be correct, leading to biases.
This problematic set-up happens, most prominently, with machine learning, a way for software programs to match patterns and make a conclusion. Machine learning depends on the data sets it uses to learn the patterns and make decisions. This effect explains why facial recognition technologies recognize white males better.
If technical writers use data sets skewed to a particular demographic, then the authors run the risk of misinterpreting and misrepresenting the analysis. So, technical writers need to know the data’s origin to get impartial documentation.
Two data literacy examples
Here, I describe two data literacy examples of where good data literacy helped.
When writing this article, I wanted useful information about data literacy. I chose a recent, well-cited, and regarded study compiled in 2020 that would be readily available and transparent, The Human Impact of Data Literacy.
Although the study finders, Qlik and Accenture do sell technology platforms and services, they did not stand to make an immediate profit from the study. A neutral market research firm, Opium Research, conducted the study and surveyed 9,000 people globally. So, the study promised objectivity with perhaps a little subjective pro-technology bent.
The Qlik and Accenture study highlights a significant gap in data literacy throughout the study, suggesting room for improvement among many workers. Other online articles from credible sources also reported such a gap. Given this study’s criteria, I could be reasonably comfortable using it to talk about data literacy improvement.I had a project to turn a software check-in flow chart into a how-to guide. I needed to interview the developer to understand each step in the flow chart and translate it into meaningful instruction.
To ask relevant questions of the developer. I needed to understand how to read a flow chart like a developer to know what shapes represent inputs, processes, and results. I read an introduction to flow charts by reputable programmers and applied what I learn to my writing.
Through this project, I improved my data literacy by learning when a delay in getting data happens, to ask my resource how much research to estimate how much research is left to get a sense of scope. Since I did not bring this question up to my client, I worked the entire weekend to complete the guide. If I had brought this question up, I could have negotiated with the client to write only about the available data.
How to improve your data literacy as you work?
As the examples above show, you can improve your data literacy skills while you work. Please see the tips below:
Learn the business: As a technical writer, you will need to consult subject matter experts (SME’s) or secondary sources. Ask them about the data sources, what data they consider critical, and the conclusions they make with their data. Observe SME’s working with dashboards to see how they use data in their business.
Ask three questions while visualizing data: Ask the three questions the Buffalo News suggests when reading any charts, graphs, or other data pictograms:
1. What is this figure trying to tell me?
2. How are color, shape, size, and perspective used?
3. What is the data source?
Persist in getting clarification about these questions.Get involved with your company’s data governance: Data governance describes enterprise processes and procedures using data. Typically, cross-sections of an organization communicate together within data governance programs. This collective data resource will inform how to use data in your work to the business’ best benefit.
Pay close attention to business requirements: Should your project have business requirements and user stories, pay close attention. Before starting any documentation, know what the business requires. Bundled in these requirements, find information about how the company expects to read, understand, and use data. If they don’t exist, then ask. Requirements provide the context with which to communicate data.
Look for a business glossary: Data literacy relies on a shared language to talk about data. Business Glossaries provide the common meaning.
For example, if you look at a dashboard showing completed work orders, you need to know what constitutes a work order. You can go to the business glossary and find out what work order means. That way, when you look at the company’s data, you have a better idea of what it means and how to use dashboards and other tools.
Conclusion
Technical writers need to follow through towards becoming more data literate in 2021. Data literacy has become a mainstream language since data volumes, and variety has increased and time to make decisions decreased.
{{snippet.authorMichelleKnight}}
{{snippet.Disqus}}

Written by
Michelle Knight
Michelle combines her technical writing craft, software testing experience, and library and information science background to write articles about data management as a documentarian. Her outstanding research and analytical skills provide unique insights about sharing information across an organization. She lives in Portland, Oregon, with her husband Scott and her husky mix, Taffy. She likes crossword puzzles, mindfulness, and trying new activities. You can learn more about her on LinkedIn or her website writing portfolio.

Follow these 3 steps to improve your knowledge base
1
Get expert tips every month in your inbox
No spam, pinky promise.


2
Try the knowledge base software your team will fall in love with
Reduce tickets, make information easy to find.
Happier employees, happier customers.

3
Become the tech writer everyone respects
Check out our podcast, The Not-Boring Tech Writer.

How teams are using KnowledgeOwl
Loved by 3,200+ knowledge base authors in software companies around the world