All articles
Using Google Analytics to better understand how your software documentation is used
Google Analytics is a web analytics that tracks and reports website traffic. Learn how and why to use it in your software documentation.
Published
Category
Using Google Analytics to better understand how your software documentation is used
bri hillmer | September 28, 2016
Many documentarians[1] think of Google Analytics as a tool for marketing or eCommerce websites. Indeed much of the content on the web about how to use Google Analytics falls under the marketing banner (e.g. increasing/improving leads, campaigns, conversions, shopping cart optimization).
I'm here to dispel this myth! Google Analytics is free, easy to set up, and provides some really useful insight into how users use your documentation.
In this post, I'll cover several Google Analytics metrics that are useful for understanding and improving your software documentation. I'll also cover what success looks like for these metrics from a documentation standpoint.
Basic Metrics You Can Start Tracking Right Away
These basic metrics will be tracked as soon as you include your Google Analytics tracking code in your site, no customization required!
Sessions and Users
Sessions and Users are just two ways to measure what is effectively traffic to your documentation.
A session is a period of time a user is actively engaged with your website. A single user can open multiple sessions.
Google Analytics de-duplicates sessions in order to calculate unique users.
How To Measure Success
When it comes to your knowledge base, you want more sessions and more users. More sessions/users mean more people trying to self-help!
Don't get too excited about the dramatic increase in traffic to my documentation show below.
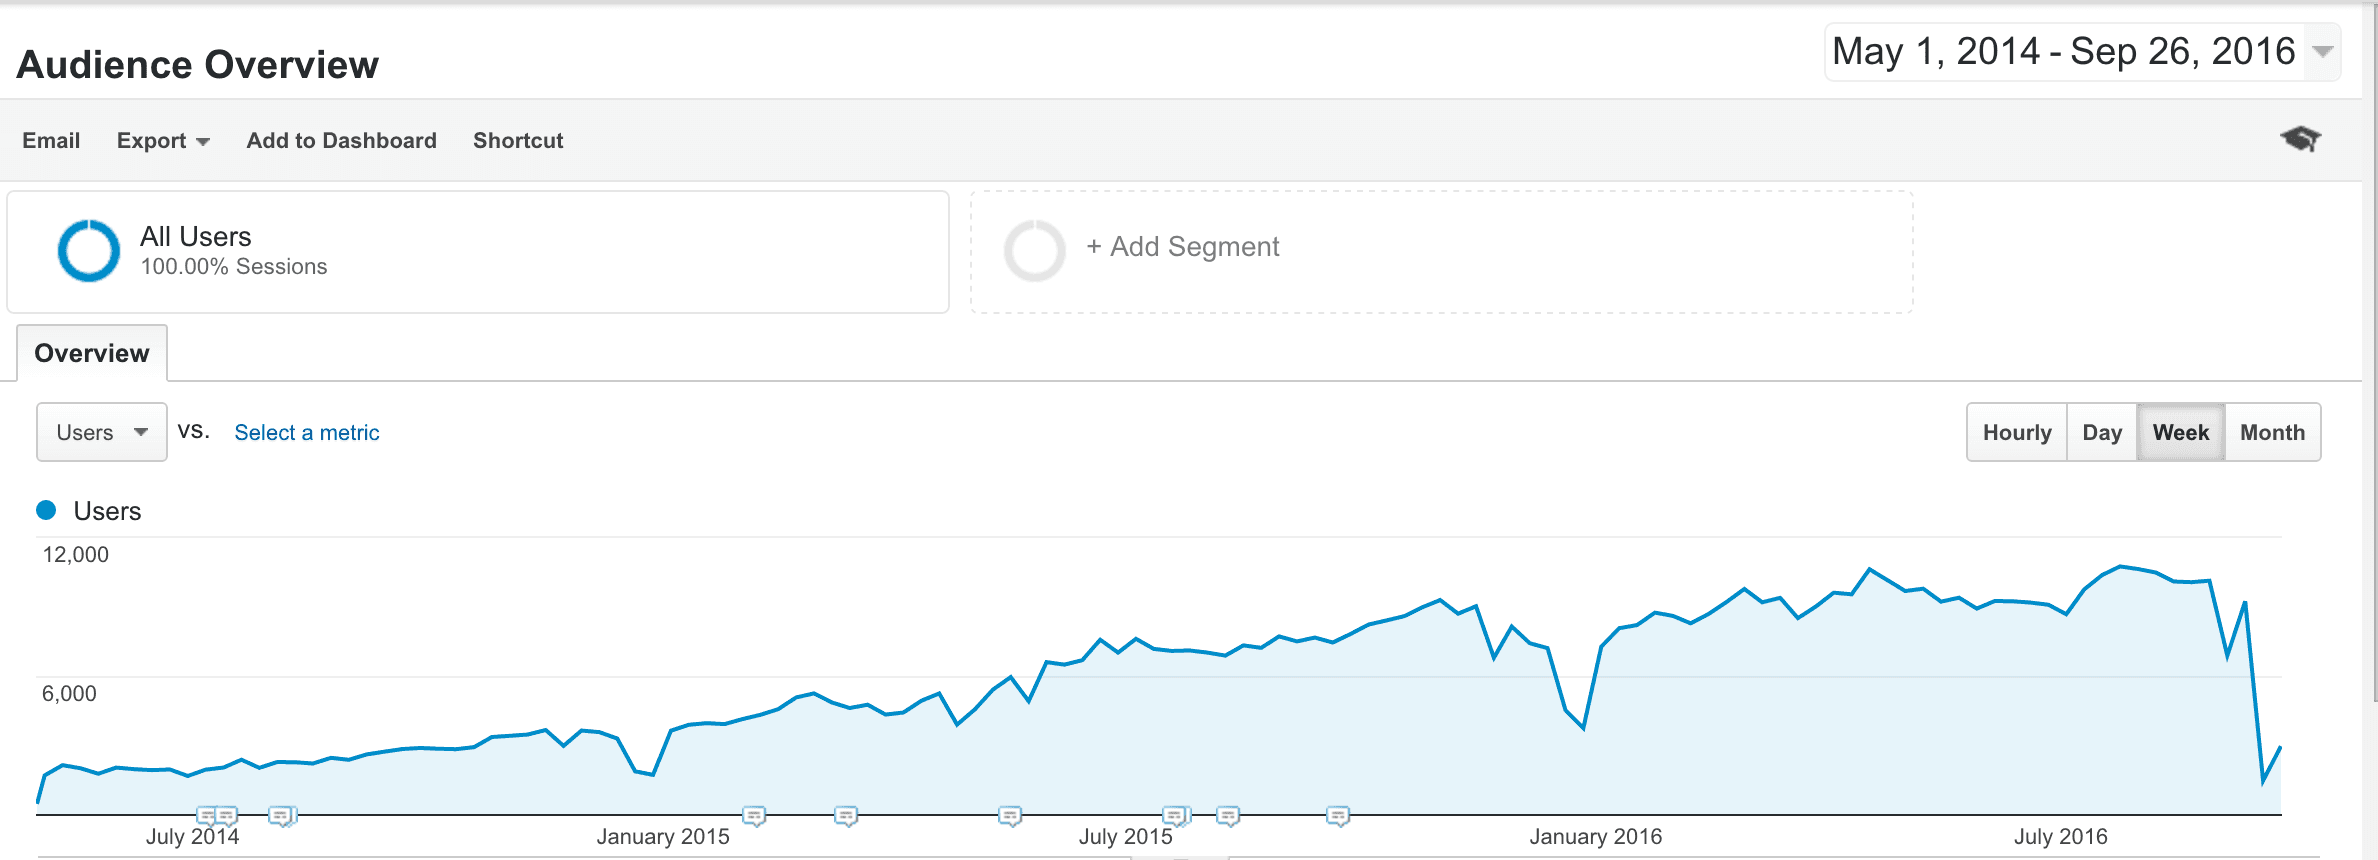
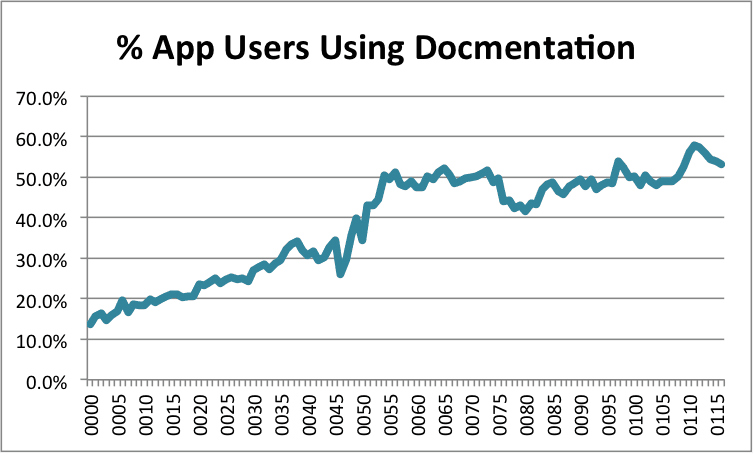
Because our sales team does a pretty killer job, users in our software application have also increased over time. This must be taken into account when considering increases in documentation users. Success means that I am continuing to close the gap between people using our application versus people using our documentation.
At SurveyGizmo we use the same Google Analytics Property for all tracking so I can simply export the traffic data for our application along with the traffic data for documentation and graph them to see how our documentation is doing.
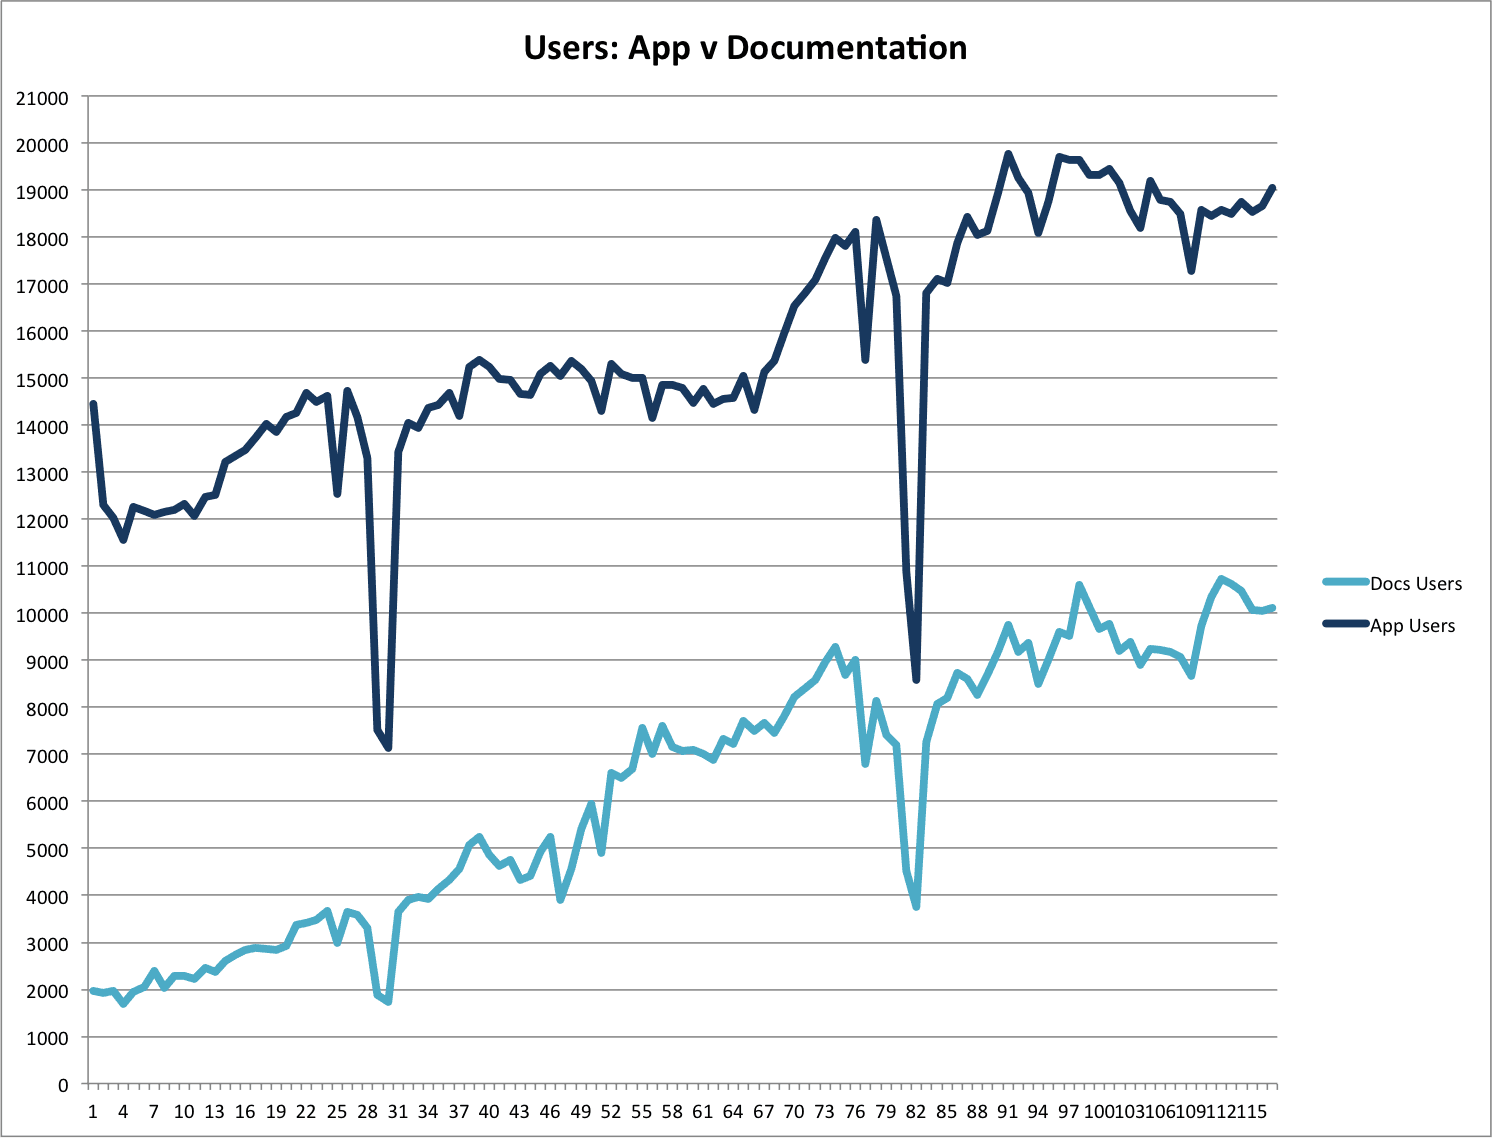
It can be difficult to tell if the slope of the docs traffic is steeper, so I often create a graph like this to get a better sense.
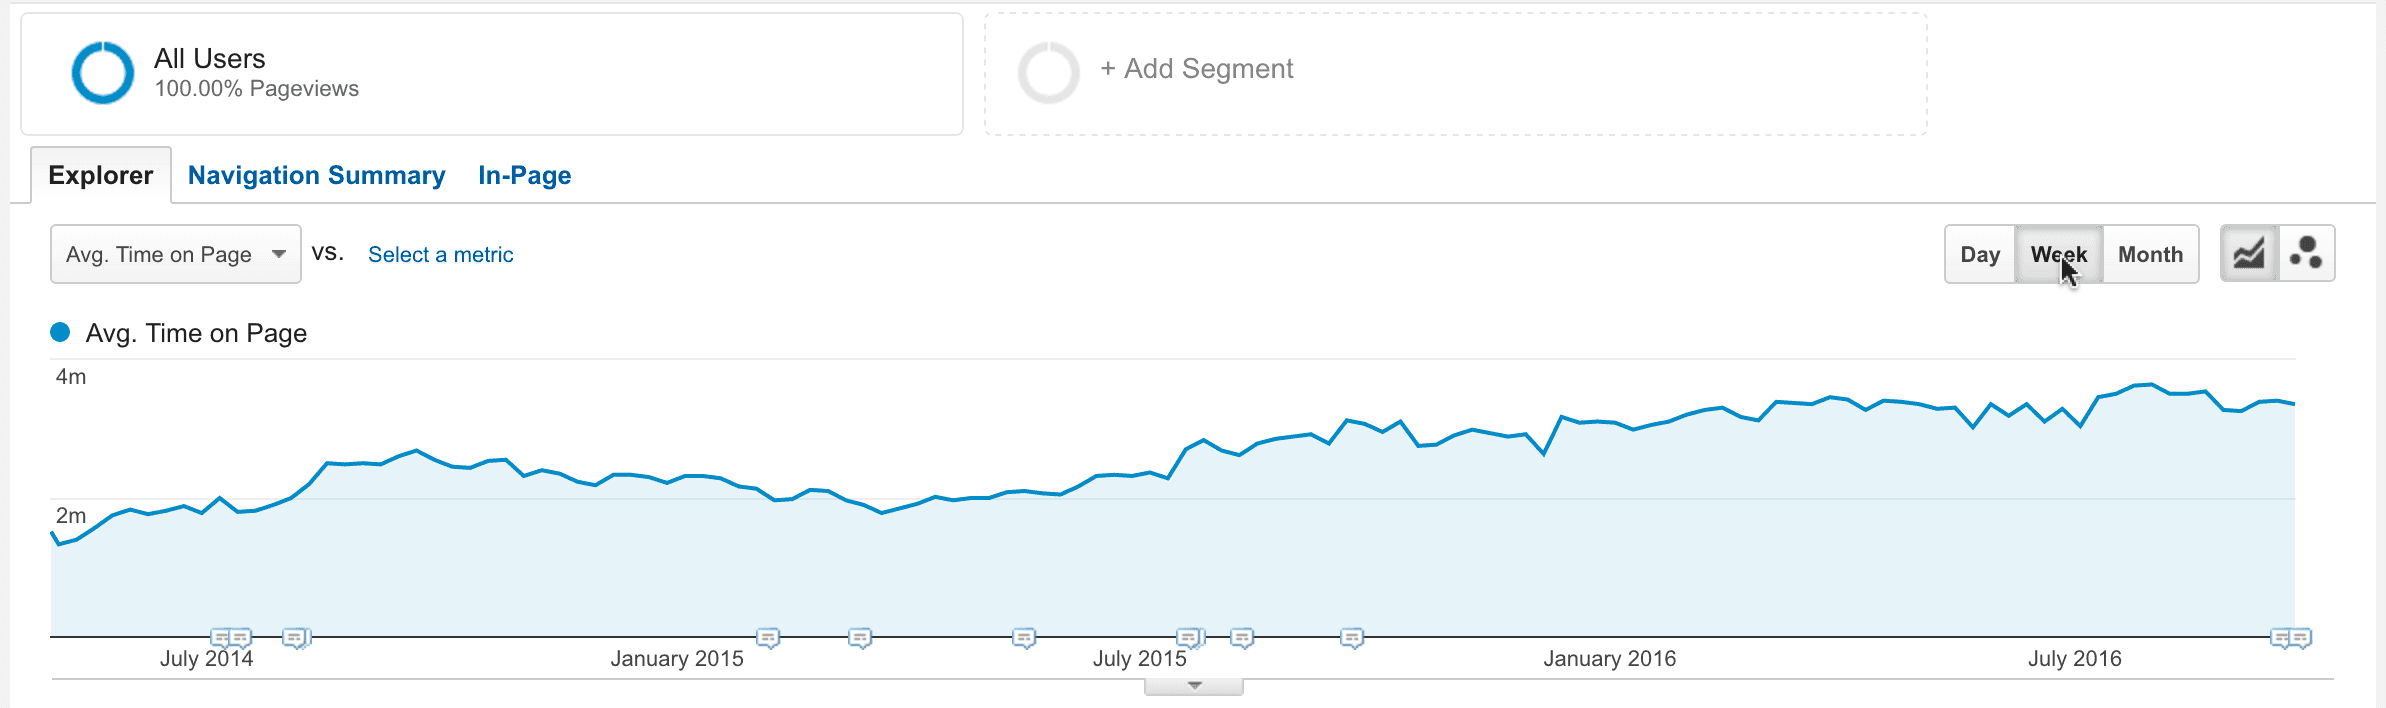
Pages/Session and Average Time On Page
Just what it sounds like, page/session is the total number of pages viewed per session.
Average time on page is the average time users spent viewing a page.
How To Measure Success
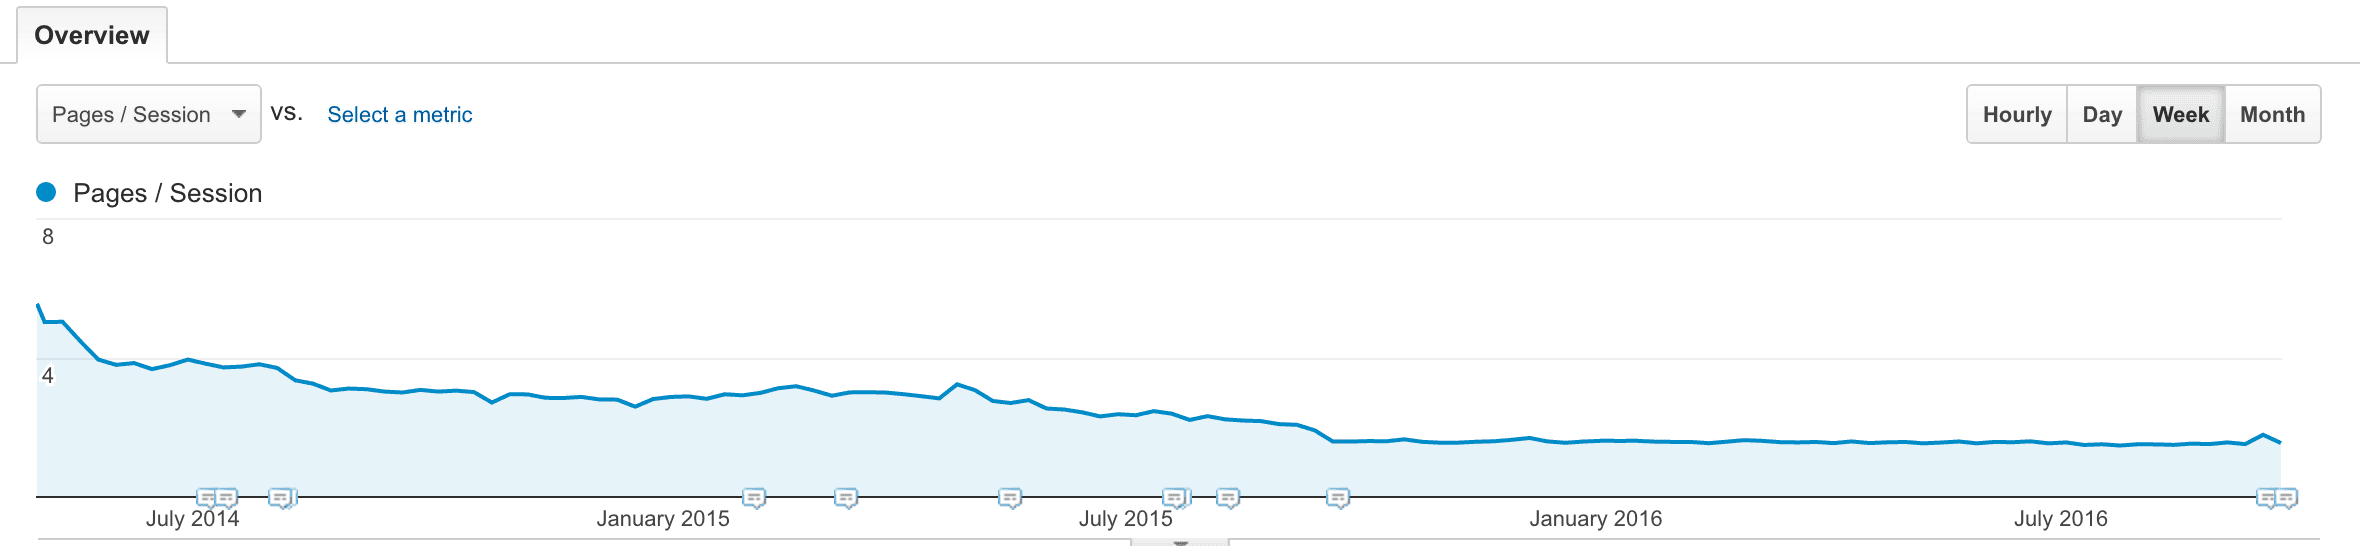
When it comes to pages per session, success looks very different for documentation content than for marketing content. Marketers typically want to keep visitors on the website for as long as possible. As such, more page views equals success for a marketing website.
In contrast, I argue that fewer pages viewed per session equal success for software documentation. Fewer pages per session mean that users are getting to an article that answers their question more efficiently.
Of course, fewer pages per session must be evaluated alongside Average time on page. Users must spend enough time consuming your content in order to consider their visit a success. Fewer page views paired with quality views (a view of 2 minutes or more) is the equation for success!
In SurveyGizmo documentation pages per session has quite dramatically decreased over time from a high point of almost 6 pages for a weekly average to a low point 1.5 pages.
Average time on page has gradually increased over time from a low point of 1 minute 20 seconds for a weekly average to a high point of 3 minutes and 38 seconds.
How To Drive These Metrics
There is no single magic trick to driving more users to your knowledge base. However, if you focus on constantly improving your knowledge base, the users will come. Here are things that I focused on that increased traffic to our knowledge base.
Writing content that answers actual user questions
Getting customers to the right content
Allow users to give feedback and act on it!
Driving overall traffic is a long game and is really just a health metric. It's fun to watch the line trend up over time, though!
Events
If you want to get really fancy you can move beyond traffic, page views, and search metrics to track how users interact with your documentation. Using Google Analytic Events you can track clicks and downloads within your documentation site.
Here are some of the events that I track in our documentation.
Ratings
Users can rate all articles in our documentation. Using an event I track when this happens and send along the article title and the rating.

Here is my code to get you started:
//Track ratings in Google Analytics $( ".hg-star-rating" ).on( "click", function() { var title = $( ".hg-article-title" ).text(); var rating = $(this).data('rating'); ga('send','event','Rating',title,rating); });
Comments
Users can also comment on all articles in our documentation. Using an event I track when this happens and send along the article title to Google Analytics.
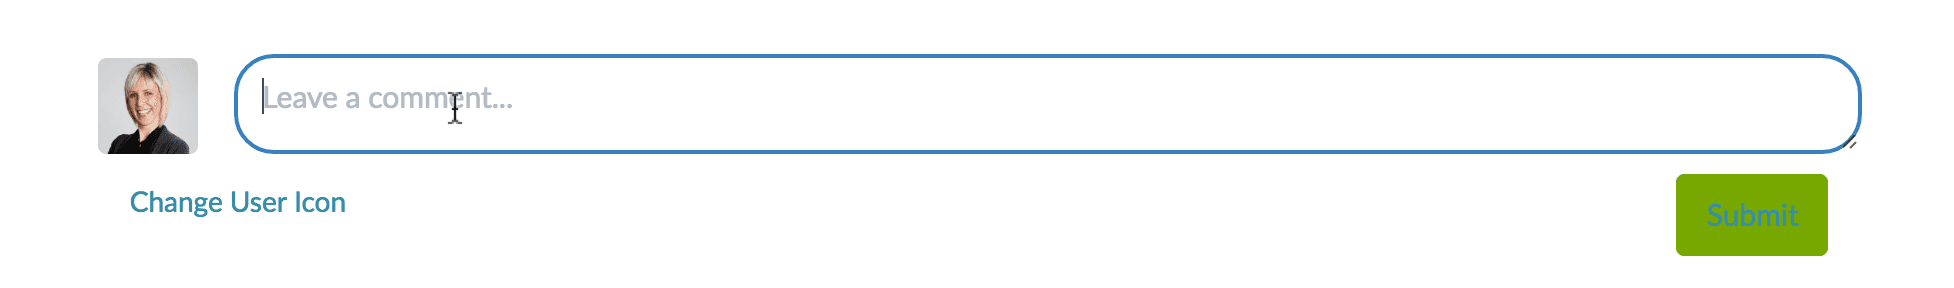
Here is my code to get you started:
//Track comments in Google Analytics $(function() { $( ".comment-submit" ).on( "click", function() { var title = $( ".hg-article-title" ).text(); ga('send','event','Comment',title); });
Share Options
Within in article users can download a PDF of the article or email the article. Using an event I track when this happens and send along the article title to Google Analytics.
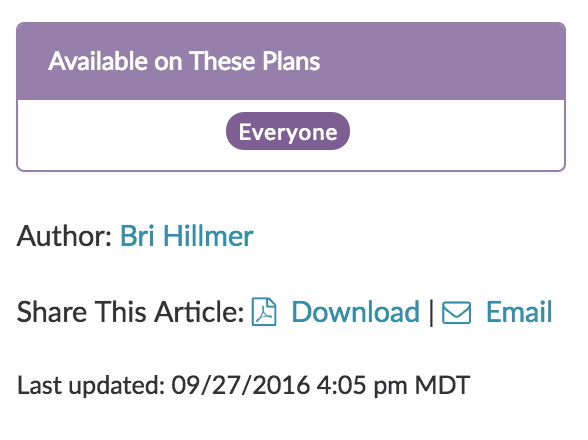
Here is my code to get you started:
//Track pdf downloads in Google Analytics $( ".hg-article-pdf.pdf" ).on( "click", function() { var title = $( ".hg-article-title" ).text(); ga('send','event','PDF Download',title); }); //Track when articles are emailed in Google Analytics $( ".email" ).on( "click", function() { var title = $( ".hg-article-title" ).text(); ga('send','event','Emailed Article',title); });
Example Survey/Download Survey
Within many of the article in our documentation, I provide both an example survey for users to click and view as well as an example survey that they can download to their account. Using an event I track when this happens and send along the article title to Google Analytics.
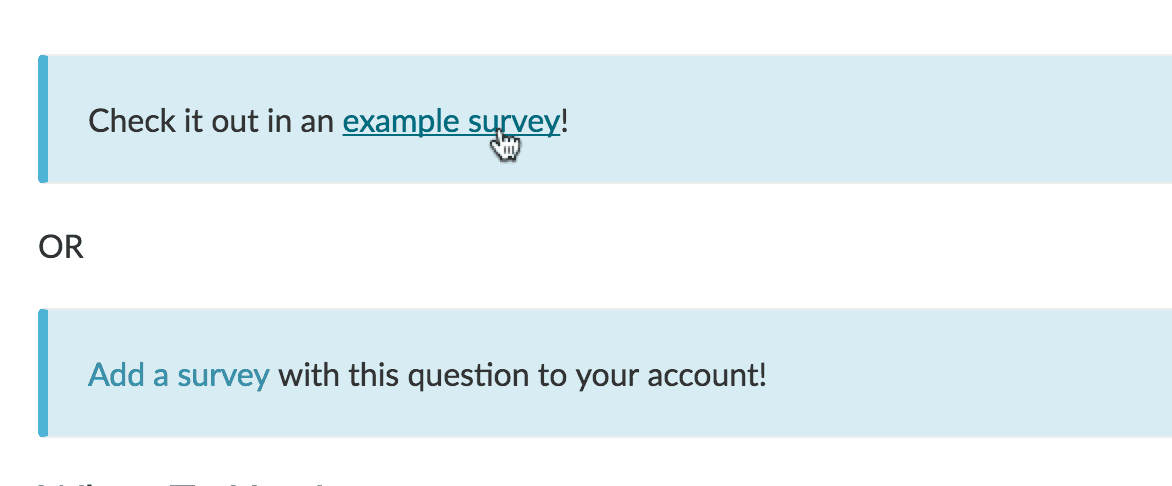
Here is my code to get you started:
//Track when example surveys are accessed in Google Analytics $( ".examplesurvey" ).on( "click", function() { var title = $( ".hg-article-title" ).text(); ga('send','event','Example Survey',title); }); //Track when example surveys are downloaded in Google Analytics $( ".downloadsurvey" ).on( "click", function() { var title = $( ".hg-article-title" ).text(); ga('send','event','Download Survey',title); });
Homepage Navigation
I am also interested in the use of the navigation panels available on the homepage of our documentation. By tracking each of these as events in Google Analytics I have info on which categories are most popular.
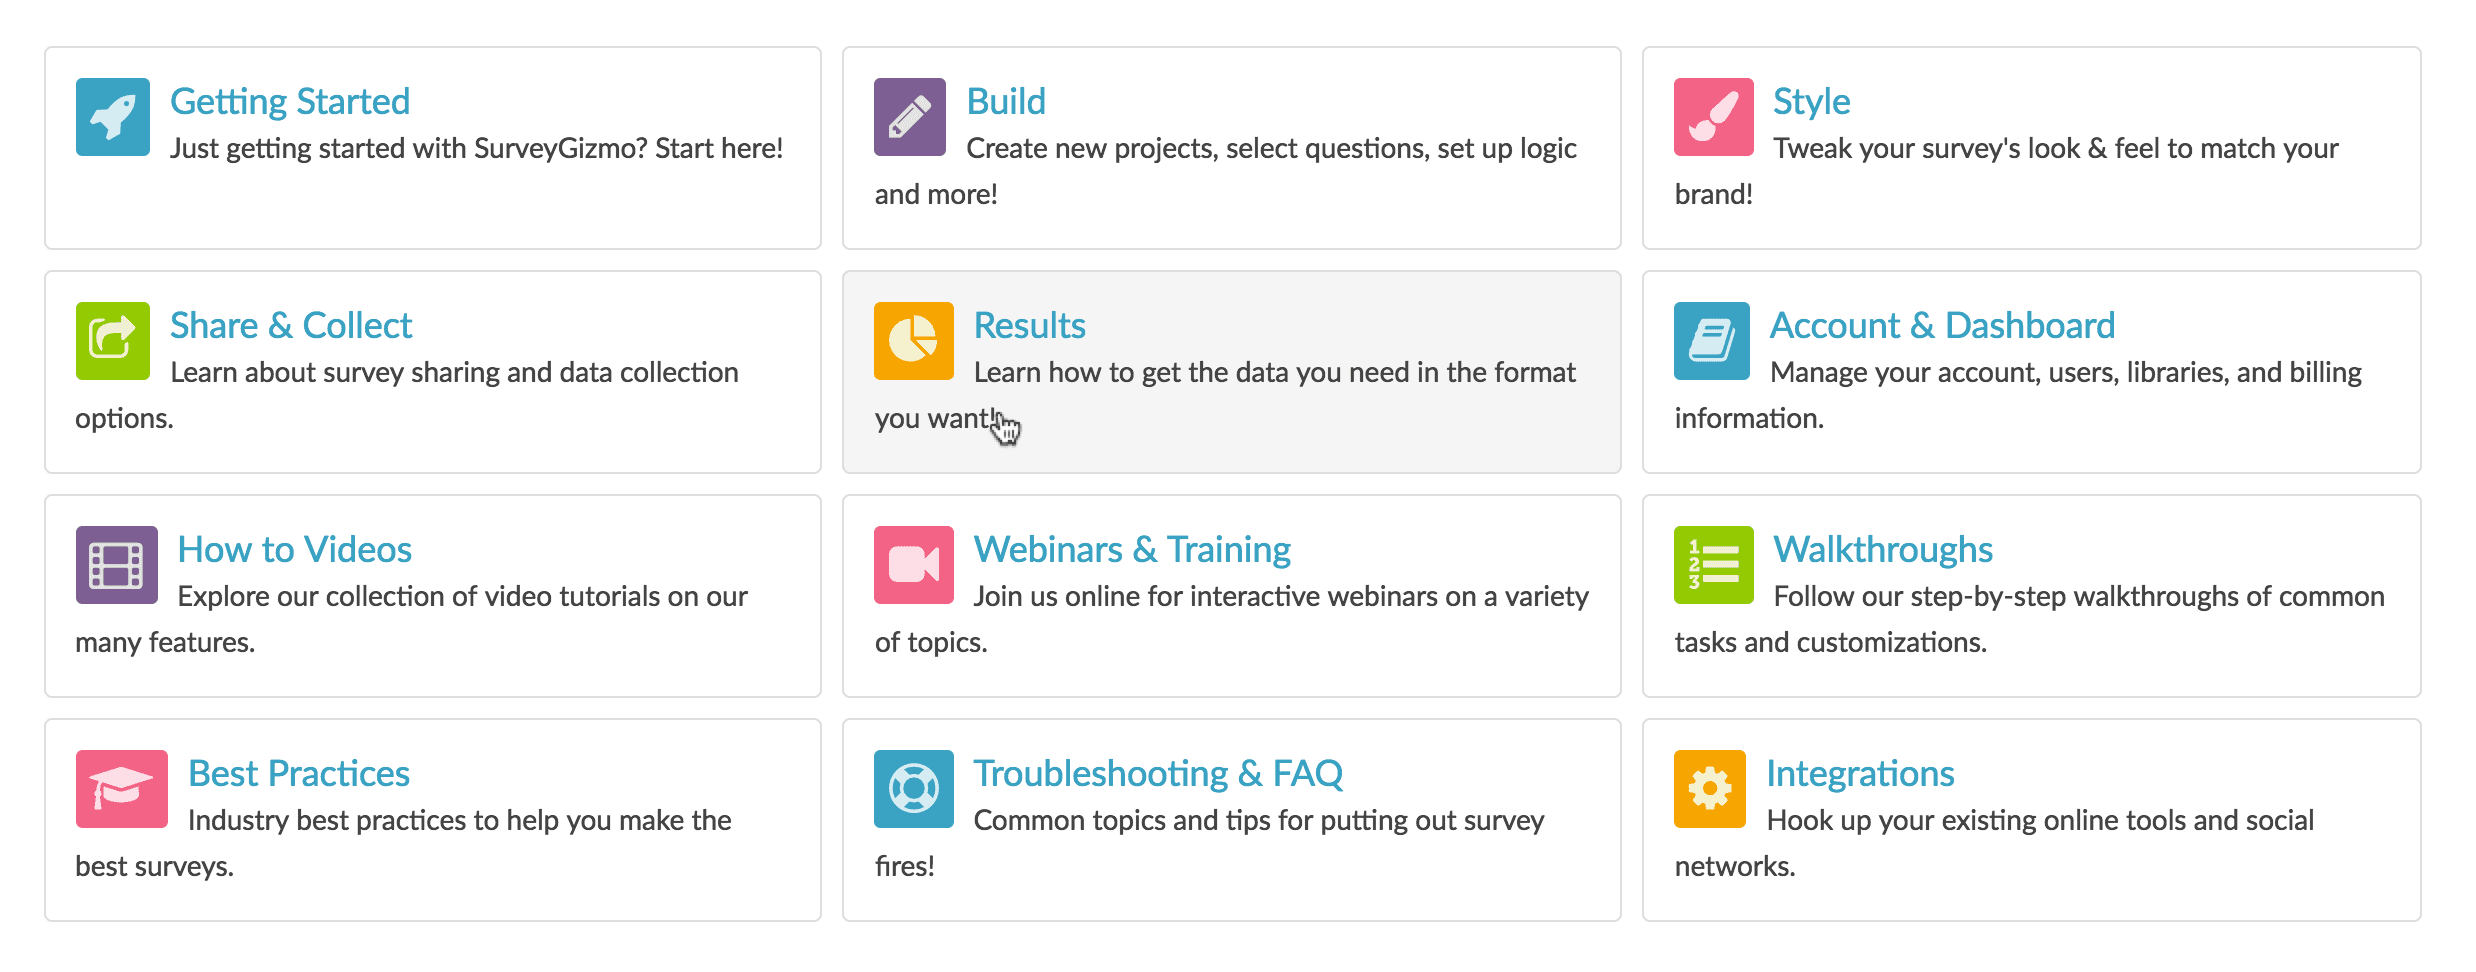
Here is my code to get you started:
//Track when homepage panels are clicked in Google Analytics $( ".home-page-panel" ).on( "click", function() { var title = $( ".category-text" , $(this) ).text(); ga('send','event','Homepage Panel',title); });
Homepage Featured Articles
Finally, at the bottom of our documentation home page, we feature first-time user content, popular articles and new articles. By tracking these events in Google Analytics I can better understand what content gets the most traction.
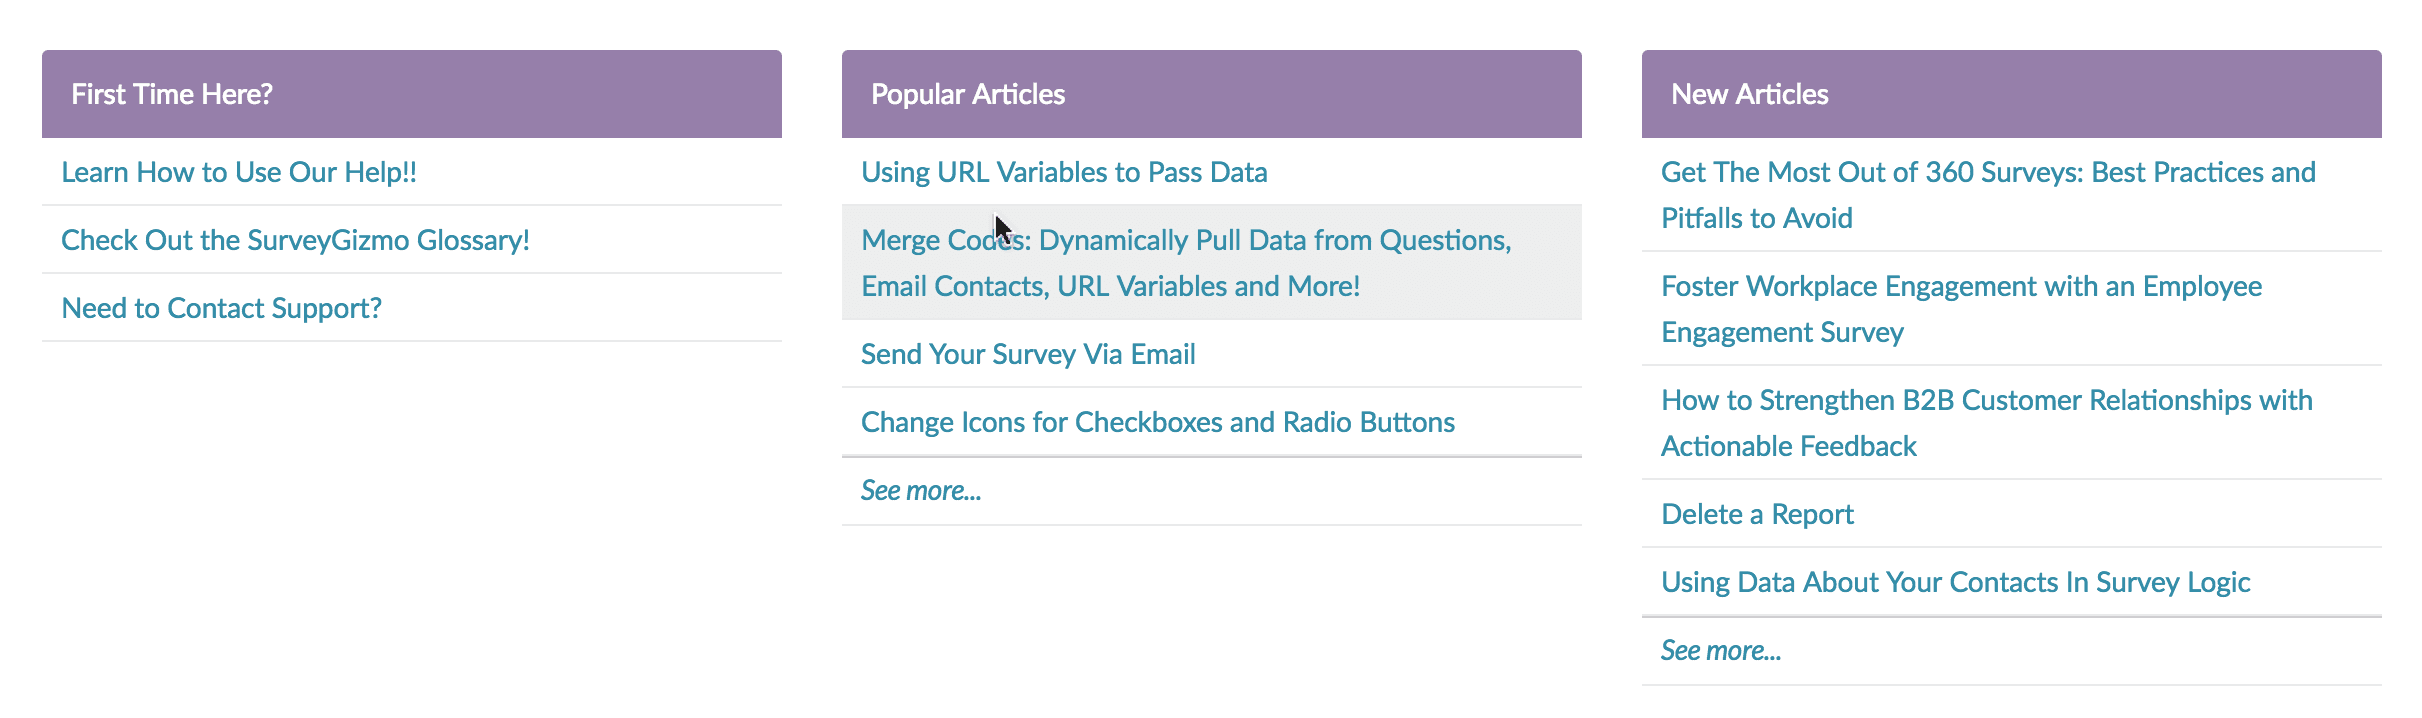
Here is my code to get you started:
//Track when popular articles are clicked in Google Analytics $( ".pop-articles-list li" ).on( "click", function() { var title = $( "a" , $(this) ).text(); ga('send','event','Pop Article',title); });
How Do I Set It Up?
As difficult as it is for this documentarian to resist, I'm not going to re-write Google's documentation[2] in this post.
Though, if you are using KnowledgeOwl, you're in luck; I wrote this post for setting up Google Analytics in KnowledgeOwl.
Tips and Tools
Here are some Google Analytics tips and tools I wish I would have known about when I started using Google Analytics.
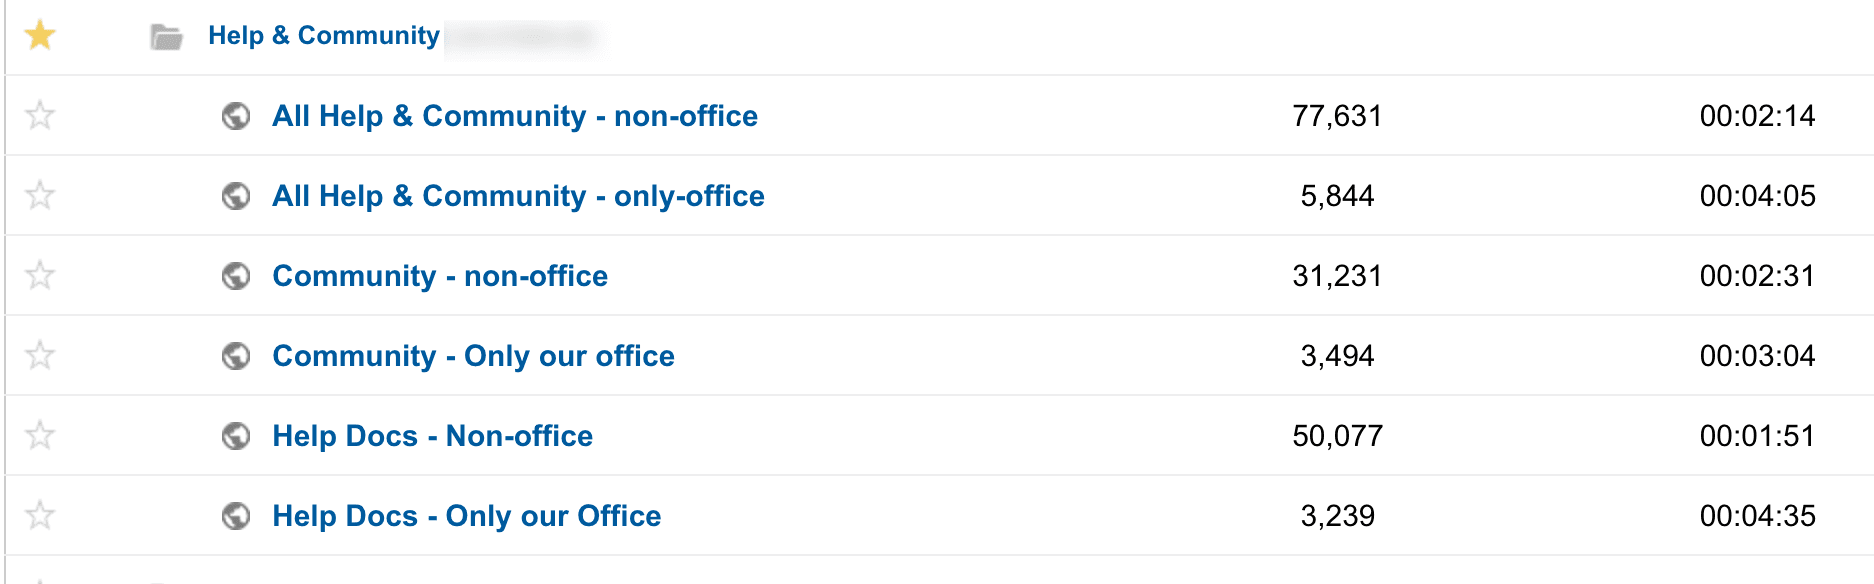
Use Views and Filters
You probably get a fair amount of traffic to your documentation internally. To get the most out of your Google Analytics data you'll want to filter this data out. To filter out traffic from employees, you need to know your company’s public-facing IP address(es). I usually just google "what is my IP" to get this information. Alternatively, you could ask your IT department to ensure that all IPs that should be removed are. Then just add a filter[3] to your Google Analytics account and apply it to the property and view you wish to apply it to.
I recommend applying filters to a custom view[4] in Google Analytics. When you create a property[5] in Google Analytics, a default view will be created called All Web Site Data. For any given property, you can have as many views as you would like.
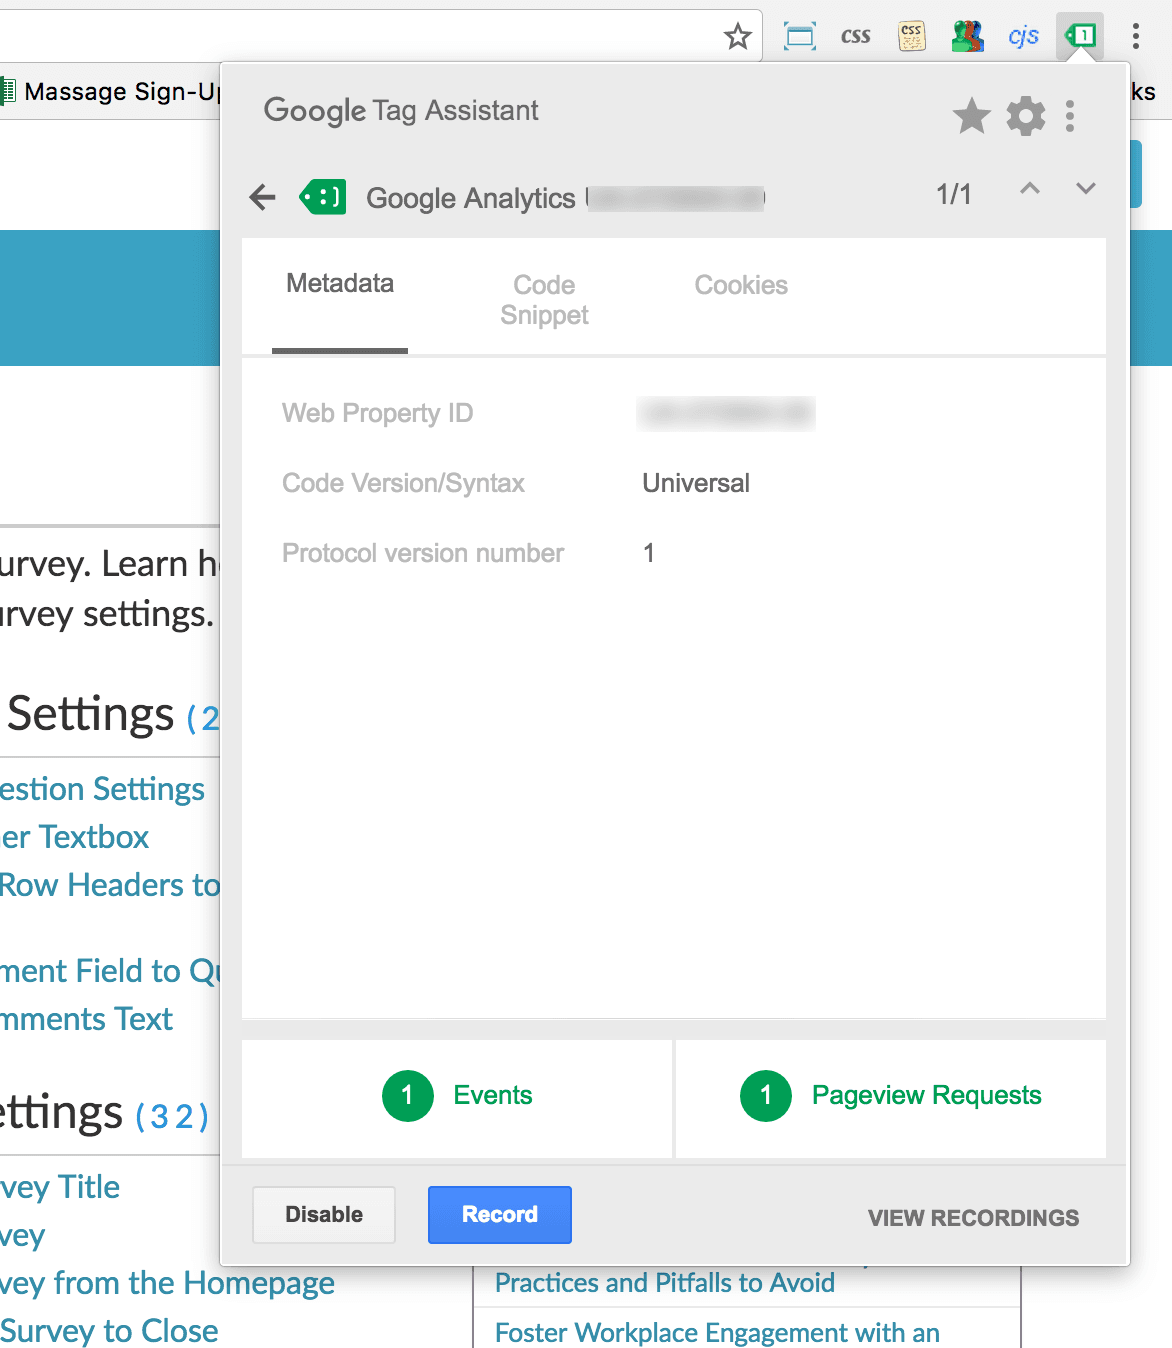
Use Google Tag Assistant
Use the Google Tag Assistant plugin for Chrome. This handy little tool makes testing your pageviews and events super easy!
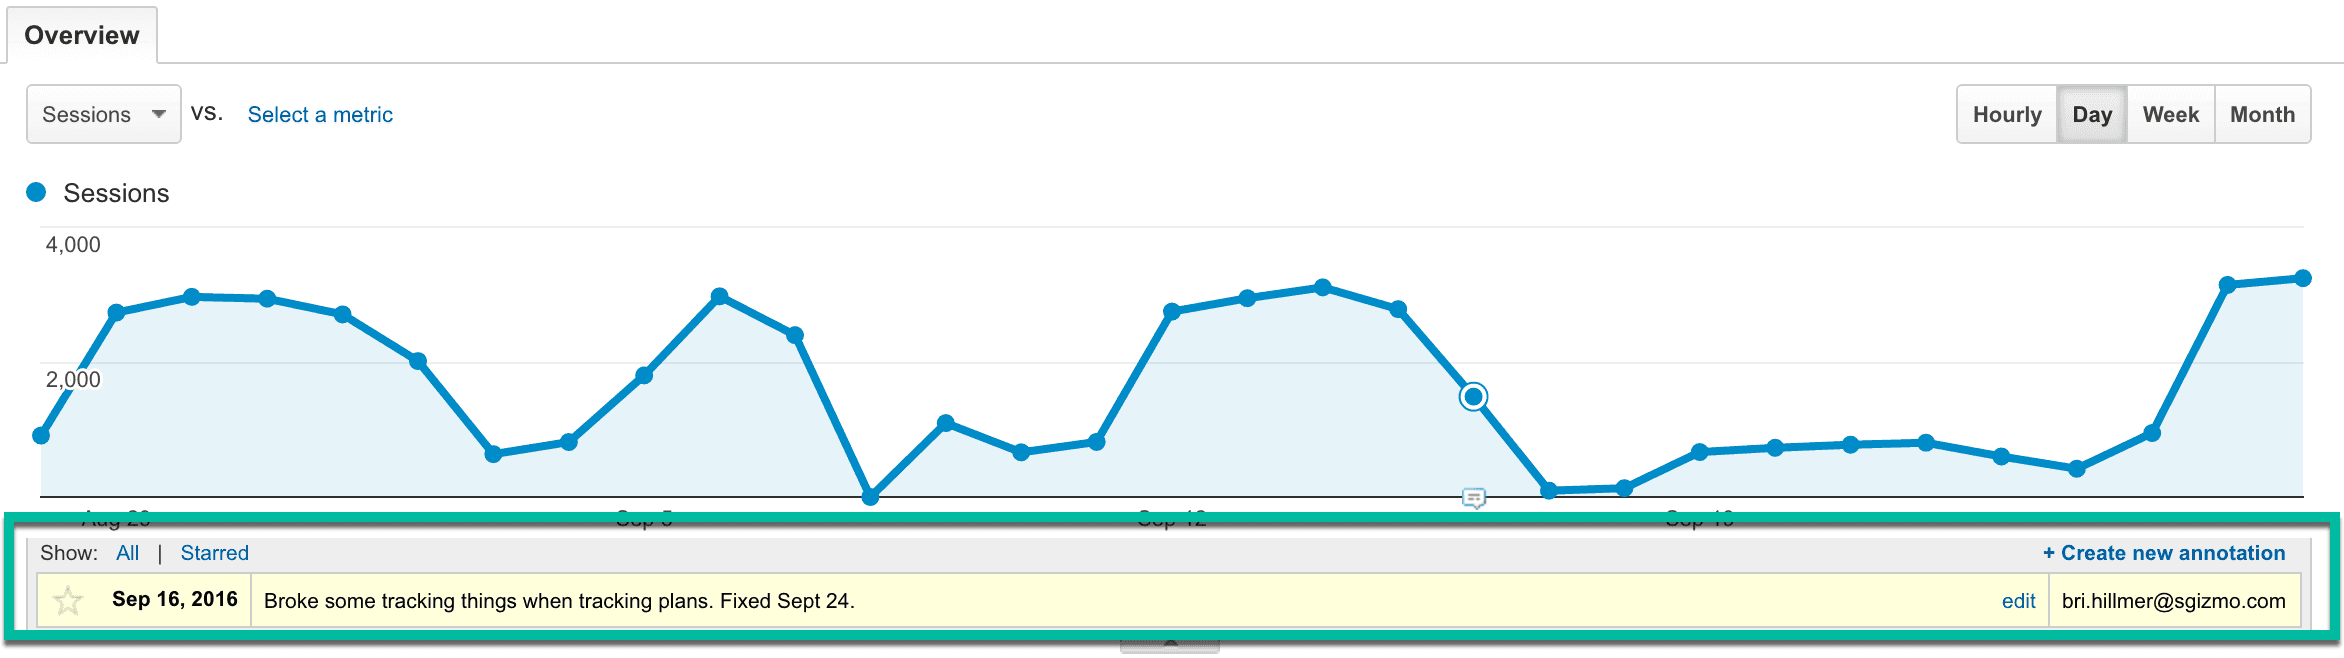
Make Annotations
For the love of all that is good make use of the annotation tool in Google Analytics when you make changes that will affect your data. Sometimes these changes are intentional (e.g. you add a filter to a view) other times they're unintentional (e.g. you broke the code info to Google Analytics); either way you won't remember, even if you think you will.
[1] http://www.writethedocs.org/documentarians/
[2] Get Started With Google Analytics, Set Up Analytics Tracking
[3] Add A Filter To Your Google Analytics Account
[4] Add A View To A Google Analytics Property
[5] About Google Analytics Properties
{{snippet.BriHillmer}}
{{snippet.Disqus}}

Written by
Bri Hillmer
Bri is a Senior Staff Technical Writer at Splunk. An Ohioan at heart, Bri now lives in Colorado where she spends her time reading, hiking, and spending time with her dogs.
Find her on LinkedIn.

Follow these 3 steps to improve your knowledge base
1
Get expert tips every month in your inbox
No spam, pinky promise.


2
Try the knowledge base software your team will fall in love with
Reduce tickets, make information easy to find.
Happier employees, happier customers.

3
Become the tech writer everyone respects
Check out our podcast, The Not-Boring Tech Writer.

How teams are using KnowledgeOwl
Loved by 3,200+ knowledge base authors in software companies around the world