All articles
Visual communication in your technical writing
You can use visuals to break down complex information like technical detail and processes. Abstract concepts can also be made more concrete with a relevant, diagram or another type of technical illus
Published
March 5, 2018
Category
Visual communication in your technical writing
Catherine Heath | March 5, 2018
Despite their job title, technical writers frequently feel the need to present their work visually. This is due to trying to cater to different learning styles, as well as the fact that ‘a picture is worth a thousand words’. Information can just be communicated more easily with visuals.
You can use visuals to break down complex information like technical detail and processes. Abstract concepts can also be made more concrete with a relevant, diagram or another type of technical illustration.
Illustrating physical products
If you’re selling physical products that require some level of assembly or operation, technical drawings may be a key part of your repertoire.
Lego, for example, provide extensive libraries of documentation for constructing their many products. They use a mixture of illustrative visuals (the purpose is to add interest to the documentation) and instruction visuals (to explain something more clearly).
Here’s a pair of instructions from their documentation for OBI-WAN KENOBI™:
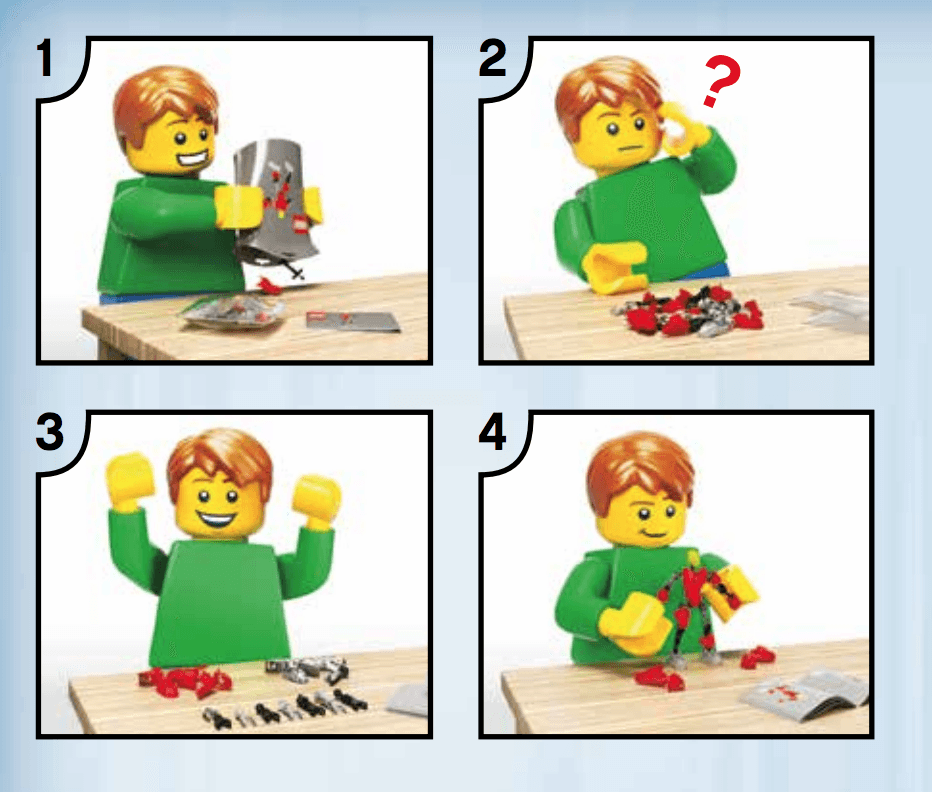
Illustrative
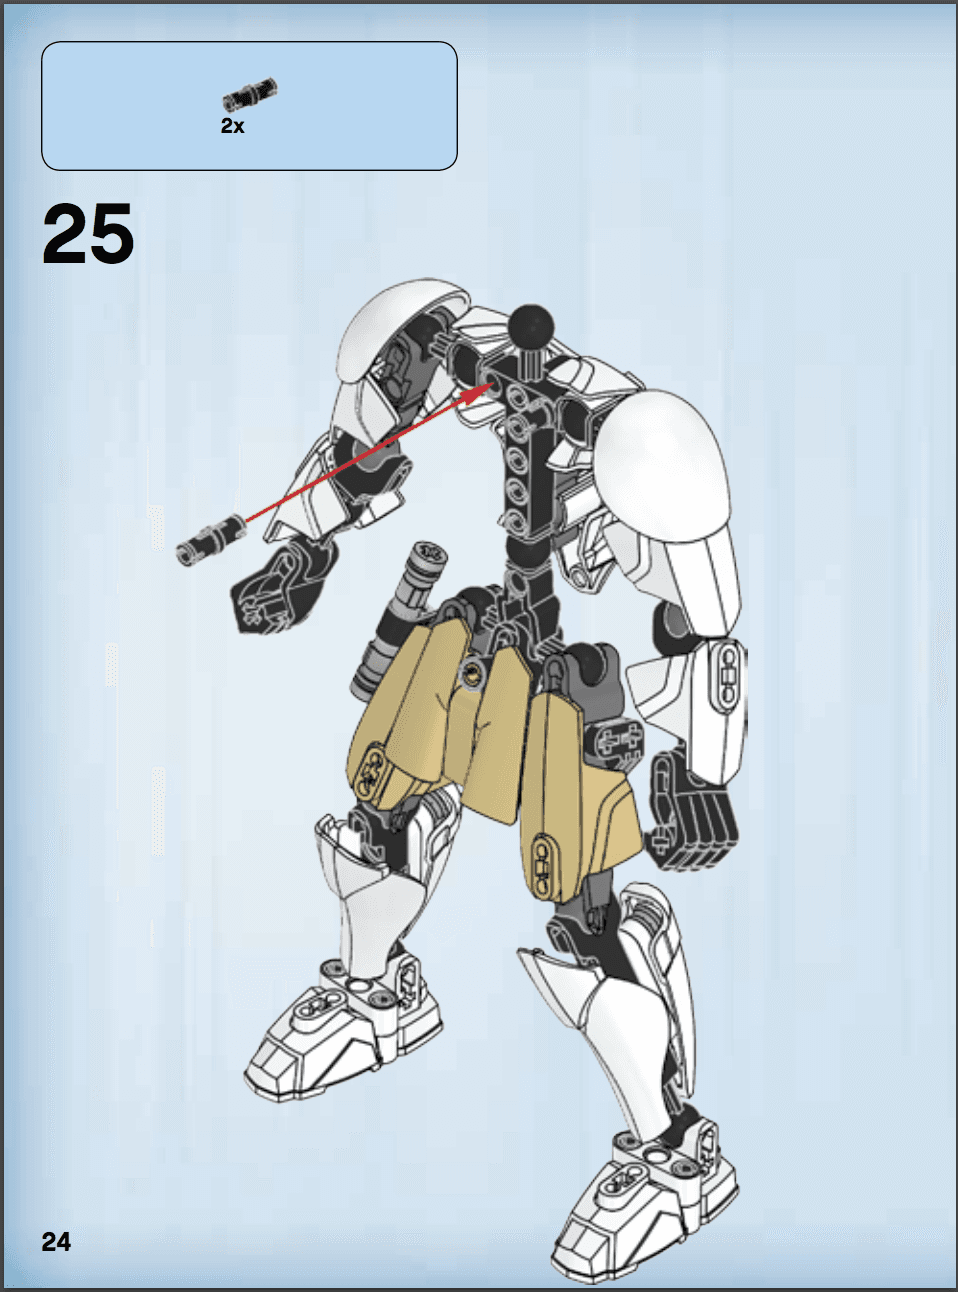
Instruction
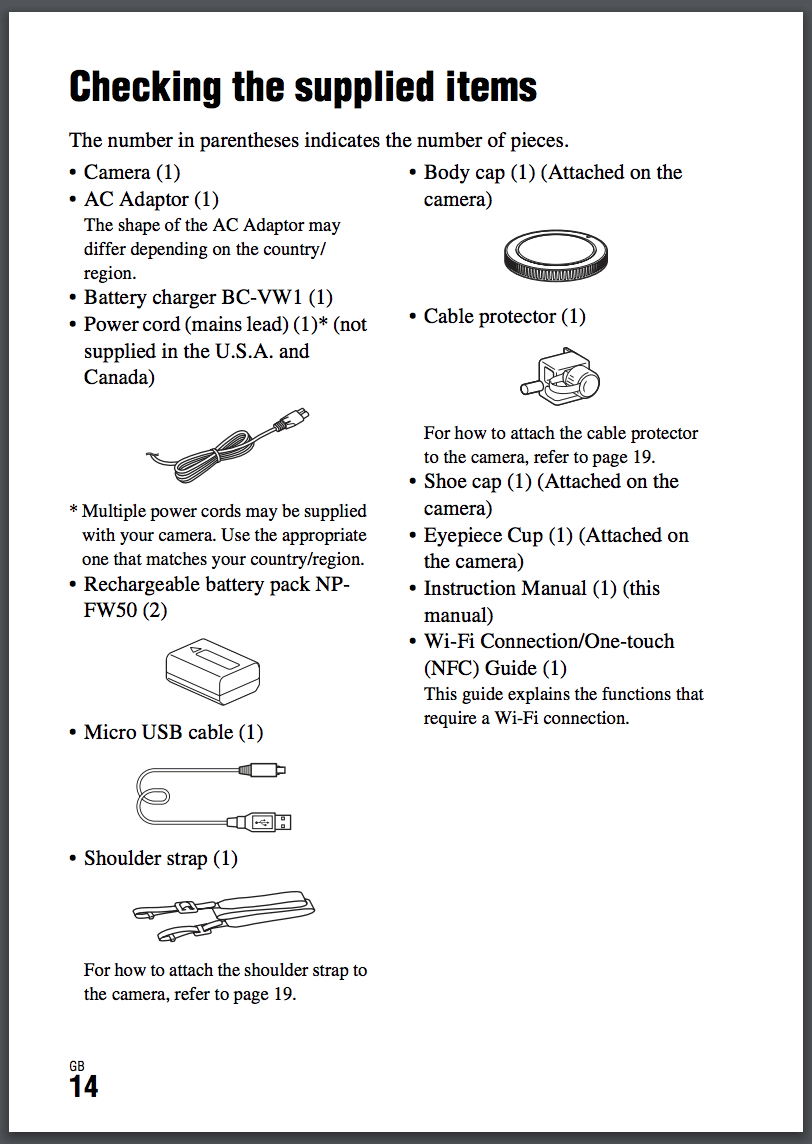
Technical illustrations can come in useful when you’re documenting your product in an instruction manual, and you want your users to check that all the parts are included. Trouble is, many users could be unaware of the technical names of the hardware. The answer is diagrams.
For example, in Sony’s documentation for their ILCE-7RM2 DSLR camera, they want their customers to check that all the parts were included with the product. They use visuals to show their customers what some of the parts look like, instead of just relying on technical names.
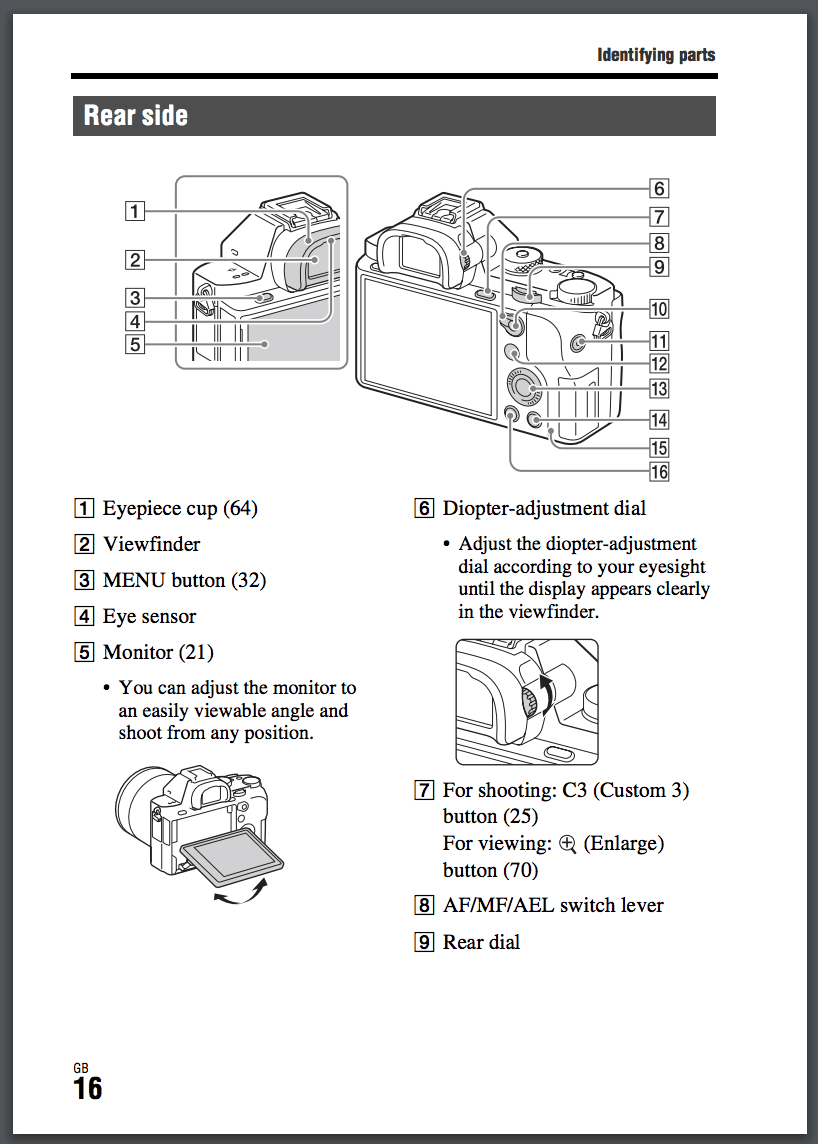
Sony also has to include operational instructions, since DSLR cameras have many available functions that wouldn’t be intuitively known. Sony has to explain how to use the camera – which comes with a multitude of buttons, switches and settings.
Once more, Sony’s customers have no idea what the different parts of the camera are called, which is a hindrance when trying to learn new techniques.
The answer is another diagram:
They use numbered points to refer to each part name, instead of trying to cram all the words into the diagram itself.
Note that these diagrams are as minimal as possible. A black-and-white line drawing is much easier for someone to comprehend and learn from than a photograph. It cuts out the unnecessary visual noise, and focuses in on what is important to learn in that moment.
Illustrating abstract concepts
Not everyone needs to be on the level of Lego (or even Sony) when it comes to creating their visual technical documentation. For other technical writers, perhaps those writing API docs, SaaS docs or any other kind of service, illustrations may be few and far between.
But there are still advantages to using visuals in your technical writing, whatever your industry.
Online course software company Teachable show their users how to use their editor with a screenshot and a small visual cue.
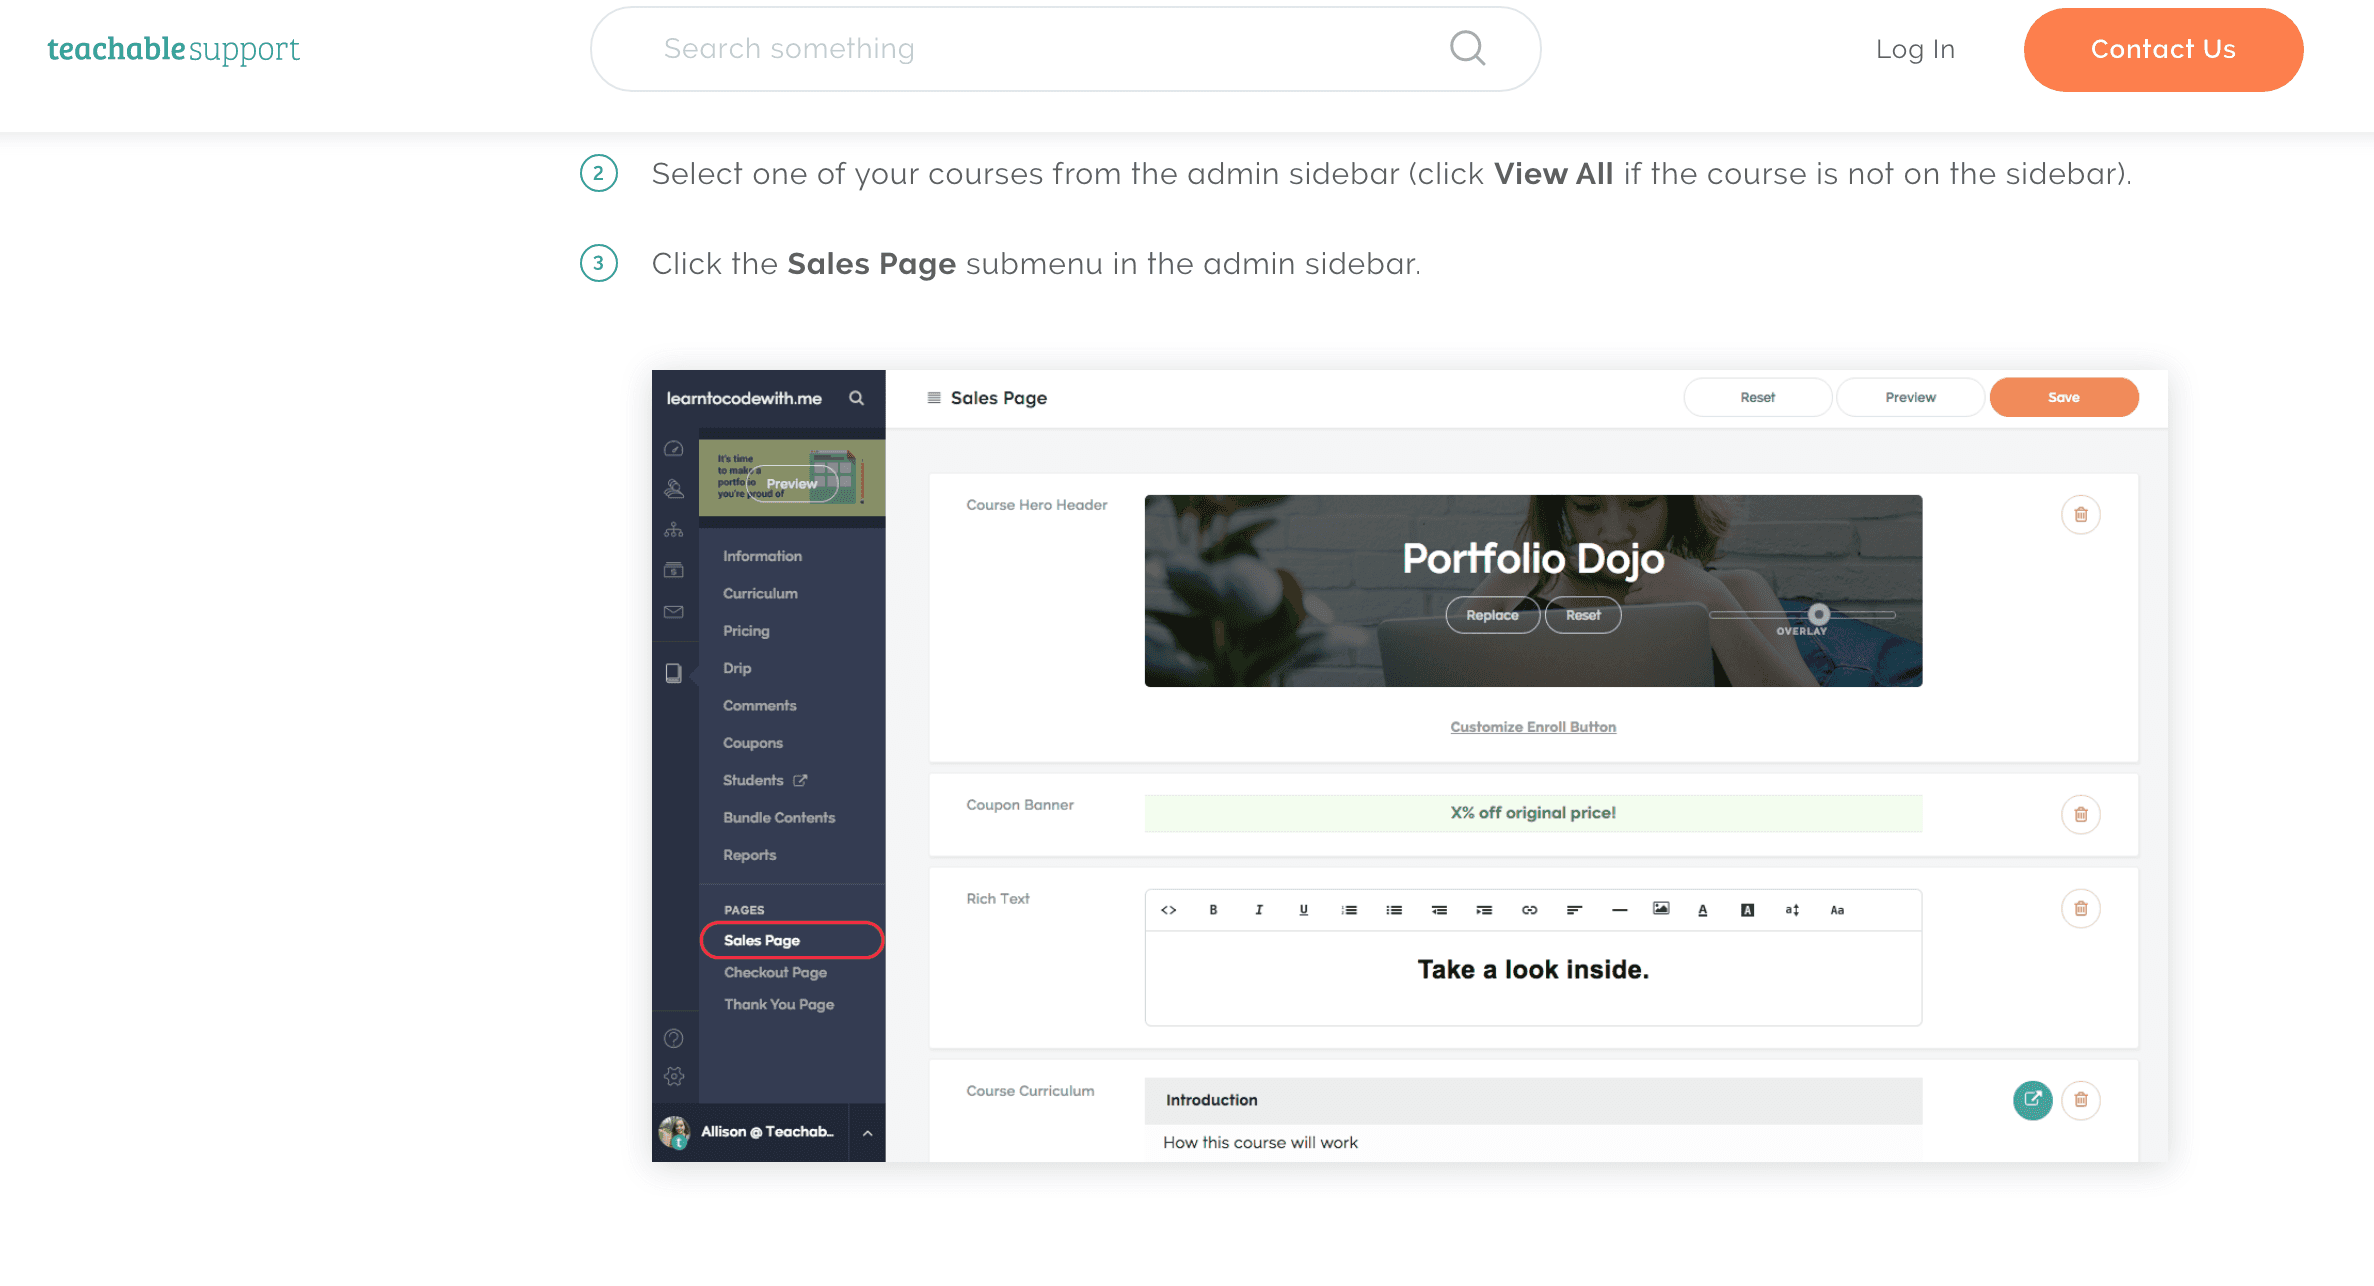
You may think it’s obvious to use screenshots and other imagery in your documentation, but a surprising number of companies rely solely on text to communicate. This results in a poorer User Experience than customers would otherwise have, and perhaps frustration with the product.
Often, abstract information can more easily be conveyed through an image, whether that’s a diagram, screen capture, flow chart or GIF. It helps to instruct your users visually, instead of trying to explain an idea using just words, which may be inadequate or open to interpretation. Visuals can make overly abstract information more tangible, such as depicting a process which would otherwise take many words to communicate.
Overcoming your fear
If you have the ability to interpret graphics that explain information, you also have the potential to come up with your own. And you don’t need a degree in fine art to create technical visuals.
Done wrong, your home-made visuals can look a bit like they were made by a child. But it may not be appropriate to outsource this work. There are tools available that can make your visual documentation look more professional.
Some technical writers may be daunted at the thought of flexing their drawing muscles, but the software we now have available means that anyone can become a technical artist (to a degree).
It’s really important to remember that images are not accessible to users using assistive technologies like screen readers. Also, screenshots will become outdated as your interface changes, and sometimes use of screenshots is just plain meaningless.
The key is to make your documentation understandable without images, but sprinkle them in using your best judgement to add more meaning.
Finding the right visual tools
Sometimes you may want to commission proper technical illustrations, in which case it would be best to hire a professional – for example, in the consumer electronics and automobile industries. These illustrations are still aimed at a lay audience but must be highly detailed, and must be to a standard that a technical writer probably couldn’t easily achieve.
Otherwise, if you just want to add it bit of clarity to your normal documentation, here are the tools that can help.
Screen captures (Snagit)
You can take your own screen captures (for example, of your product’s interface) using in-built commands on your Operating System. However, there may be times when you want a screen capture of a page that is bigger than the browser window.
Software like Snagit can come in really handy here. Snagit helps you to record your own screen captures, and you can also annotate them with visual aids such as callouts, arrows and shapes.
Diagrams (Visio)
Diagrams are a great way to bring your documentation to life, but may be a little out of reach for your average technical writer.
You can use Microsoft Visio to create your own diagrams and vector graphics. It comes with in-built templates and shapes that you can drag and drop to create your own custom imagery.
GIFs (PhotoShop)
GIFs can combine the best of static imagery and video, since it is a sequence of image stills that are combined make a simplistic animation. They could be used, for example, to illustrate a simple process. You can make your GIFs in PhotoShop, which is Adobe’s industry standard graphics editing software.
Mind maps and flowcharts (SmartDraw)
Remember mind maps (or spider diagrams)? Mind maps are a fantastic way to show how concepts relate to each other. Flowcharts can be used to illustrate more linear sequences.
SmartDraw has been designed to enable you to make diagrams such as flowcharts and mind maps, if you don’t fancy just messing around with the clipart in Word.
We wrote a whole post on the kinds of tools available to technical writers.
What type of technical illustration is right for you?
In the sciences and engineering, technical illustration is a whole field in itself. For example, it’s used regularly in aerospace and the military. In industries like consumer electronics, companies also make heavy use of technical illustrators to document your products.
Unless technical illustration is your career, you will probably just want to make do with supporting visuals like screen captures, simple diagrams and GIFs. You could also throw in a screencast or video if you’re feeling adventurous.
Start experimenting with basic visual additions to your documentation and work up from there. You can use good old-fashioned pen and paper to kickstart your ideas, and then transfer them into your favourite digital tools.
KnowledgeOwl is our very own knowledge base software, perfect for technical writers of many stripes. Take it for a free spin.

Written by
Catherine Heath
Catherine is a freelance writer based in Manchester who writes blogs, social media content, and copy. She also designs owl-based images. 🦉

Follow these 3 steps to improve your knowledge base
1
Get expert tips every month in your inbox
No spam, pinky promise.


2
Try the knowledge base software your team will fall in love with
Reduce tickets, make information easy to find.
Happier employees, happier customers.

3
Become the tech writer everyone respects
Check out our podcast, The Not-Boring Tech Writer.

How teams are using KnowledgeOwl
Loved by 3,200+ knowledge base authors in software companies around the world